


Secret Entry Points: Real Strategies and Signals for Trades
What Are Entry Signals?
Every trader looks for the “golden spot” to enter a trade. Entry signals are clues that help identify the optimal moment when the price is ready for a strong short-term movement. They show when the market is prepared for momentum and help traders make decisions based on real patterns.
Signals are divided into technical and candlestick-based. Technical signals rely on indicators, while candlestick signals are based on Japanese candlestick formations. A combined approach increases accuracy and confidence when choosing the right moment for a trade.
Technical Signals: Indicators
1. Moving Averages (MA)
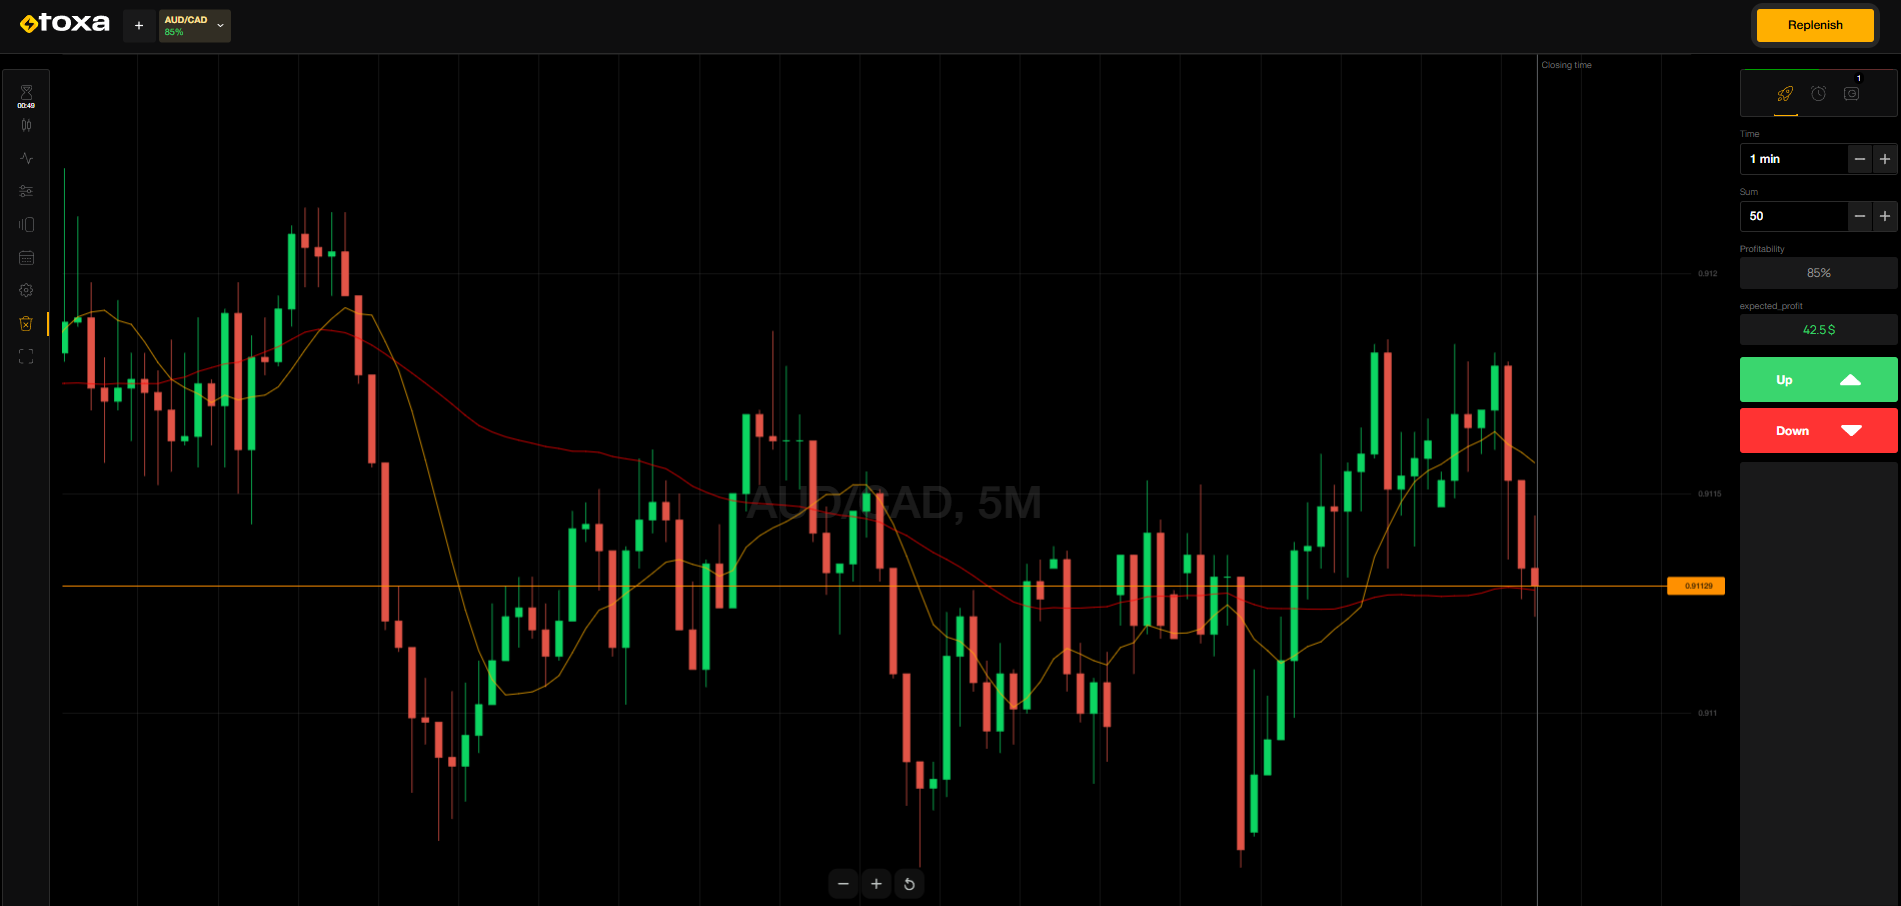
A classic method is MA crossover. When a short MA crosses above a long MA, it signals upward movement; when it crosses downward, it indicates a decline. Example: On a 5-minute EUR/USD chart, MA 10 crosses above MA 50. If RSI is near the oversold zone, this forms a reliable entry signal suggesting a high probability of upward movement.
2. RSI (Relative Strength Index)
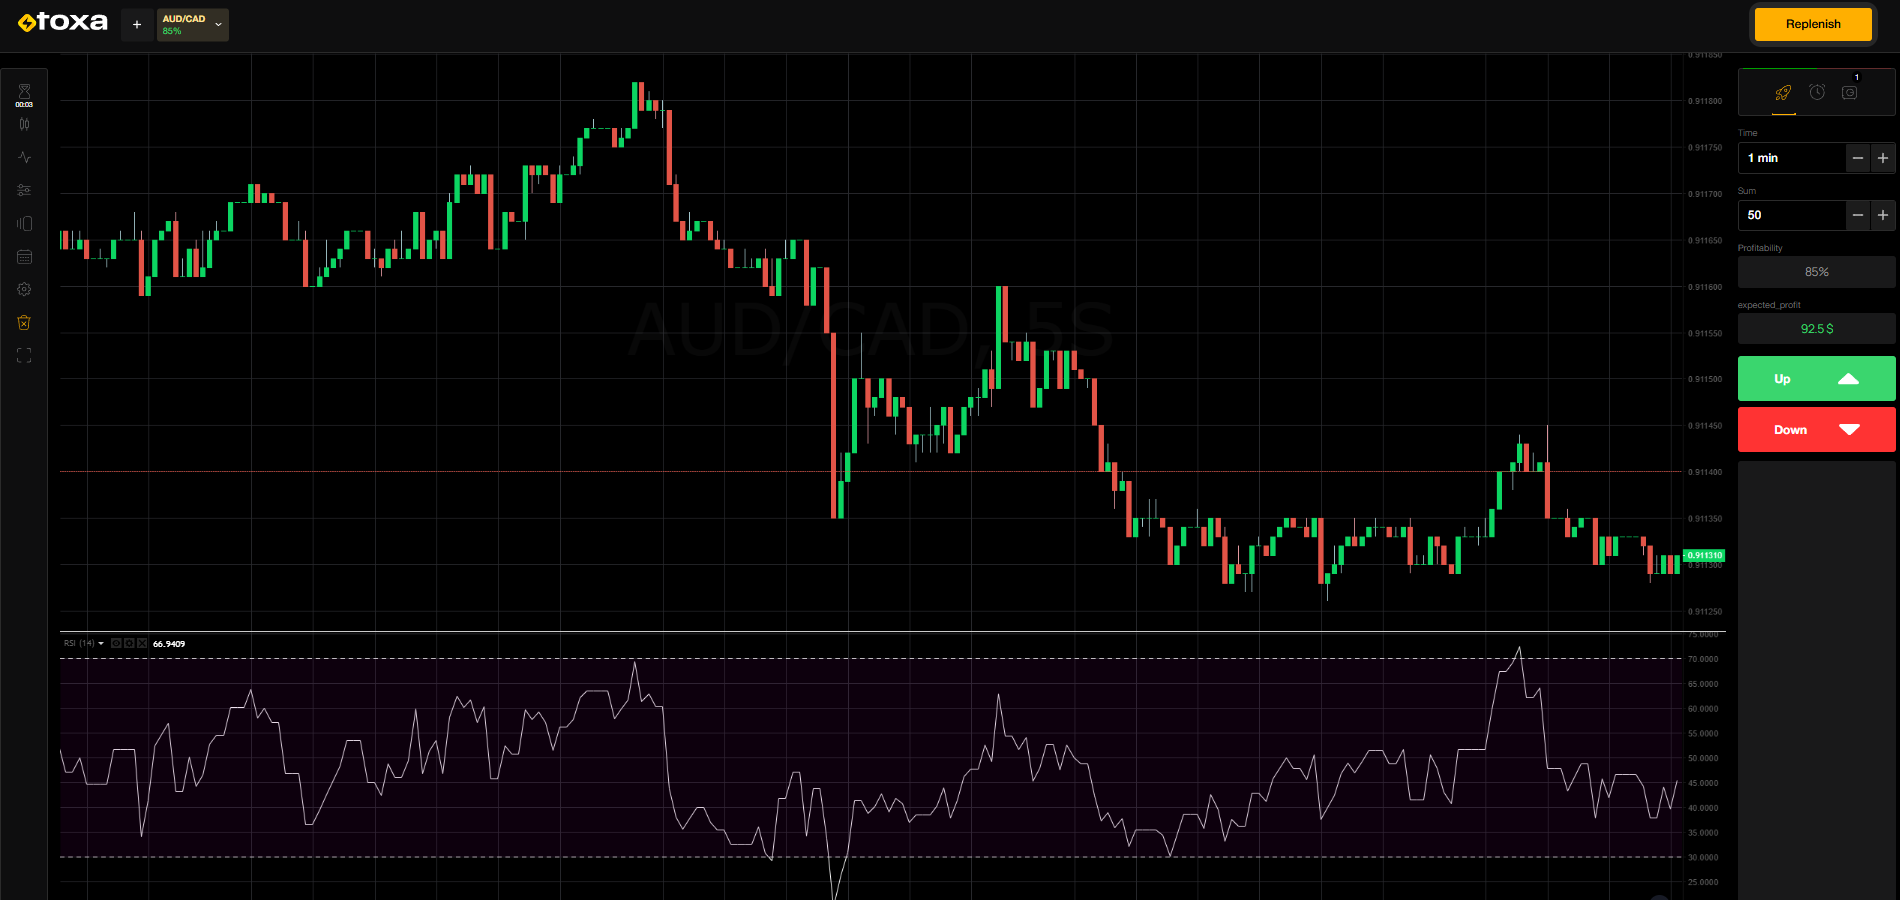
RSI helps identify overbought and oversold conditions. A reading below 30 suggests oversold conditions and a possible reversal upward; a reading above 70 indicates overbought conditions and possible downward movement. Combining RSI with MA provides more accurate entry signals when multiple factors confirm the price direction.
3. MACD
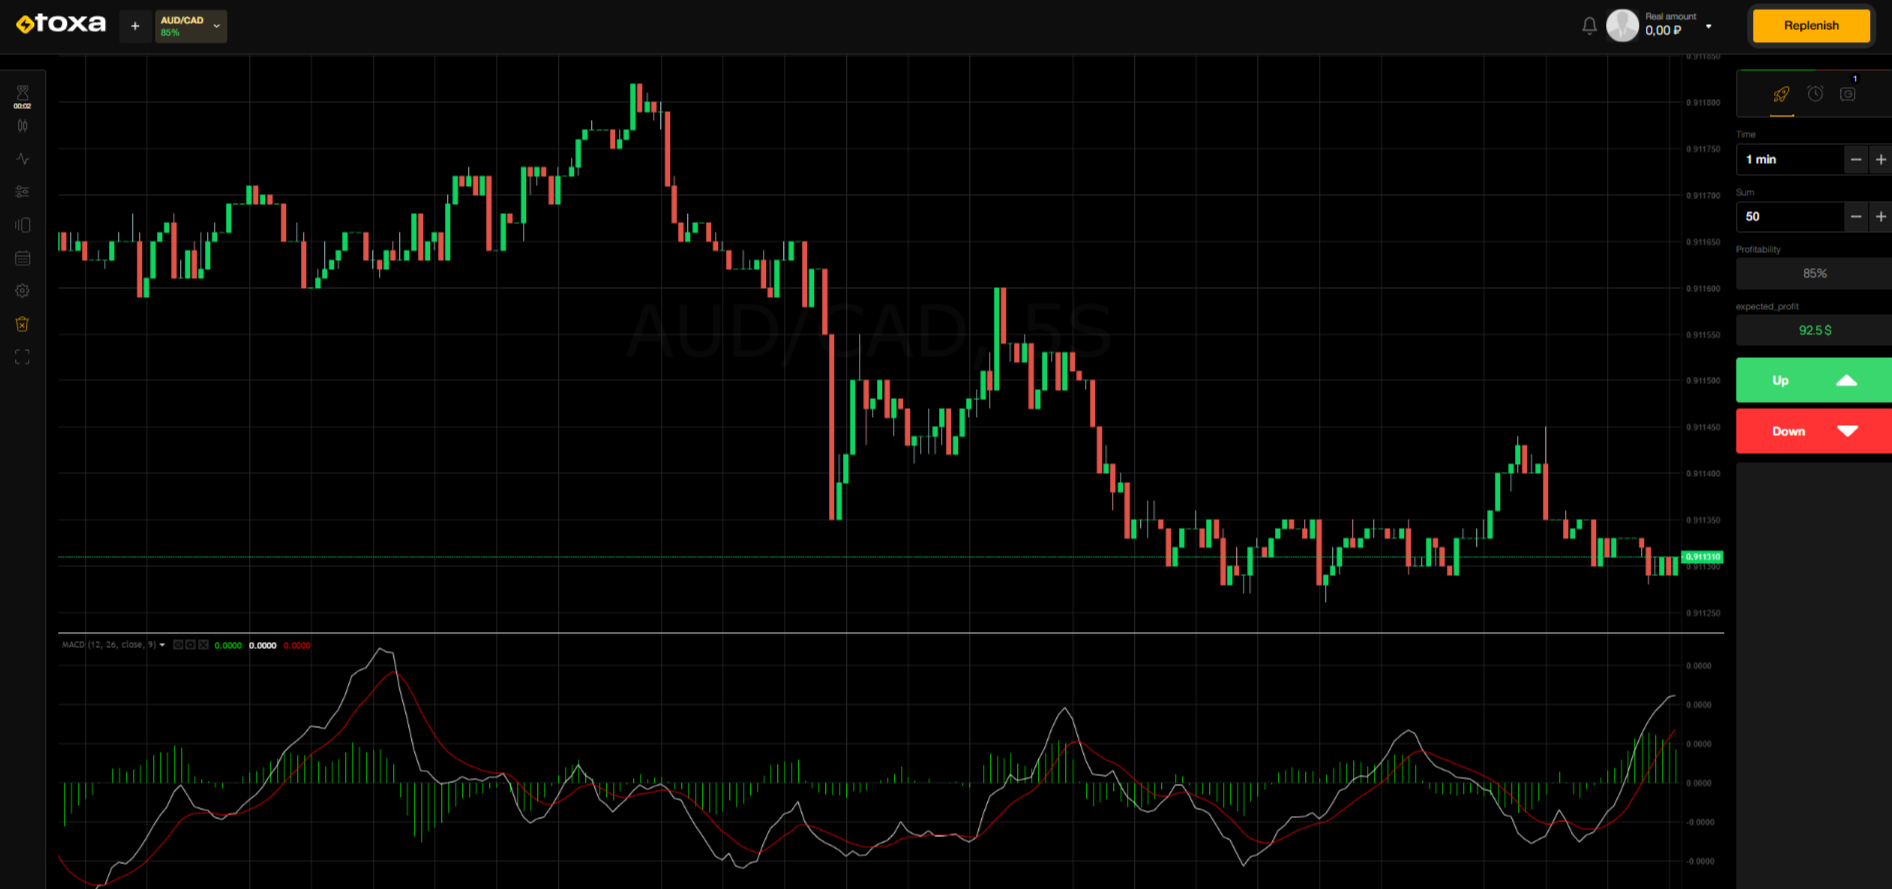
A signal appears when the MACD line crosses the signal line. Example: On a 15-minute GBP/USD chart, MACD rises above the signal line after testing a strong support level — a strong entry signal. On short timeframes, signals may be noisy, so confirmation from multiple indicators is important.
Candlestick Patterns and Market Psychology
1. Engulfing Pattern
A bullish engulfing pattern at the bottom of a downtrend shows a shift from bearish to bullish sentiment. Combining this with RSI in the oversold zone and a confirming MACD signal increases the reliability of the entry point.
2. Hammer and Hanging Man
A Hammer with a long lower shadow at the bottom of a trend signals a reversal upward, while a Hanging Man at the top indicates a downward reversal. Support and resistance levels increase the accuracy of these patterns.
Example: On a 5-minute USD/JPY chart, a Hammer forms at the support level of 144.50. RSI = 28, and MACD confirms a reversal — this is a strong entry signal for a short-term upward move.
Combined Strategies
“Candlestick + Indicator” Strategy
Identify a key support or resistance level.
Wait for a candlestick pattern to appear (Engulfing, Hammer).
Check confirmation using RSI and MACD.
When all factors align, a strong entry signal is formed, suitable for short-term price movements.
Example Strategy
On a 1-minute EUR/USD chart, the price tests the support level of 1.0820. A bullish engulfing pattern forms, RSI = 29, and MACD confirms the reversal upward. The combination of factors creates a classic entry signal when the market is ready for upward movement.
Timeframes and Filters
On 1- and 5-minute charts, signals appear more frequently but tend to be noisier. On 15- and 30-minute charts, signals are rarer but stronger. Combining short and medium timeframes helps see the bigger picture and choose more accurate entry moments.
Volume filters help distinguish random fluctuations from real movements. For example, a Hammer on increased volume at a support level strengthens the signal and confirms market participant activity, increasing the probability of a successful move.
Conclusion
Entry signals are a blend of science and practice. Indicators reveal market tendencies, while candlestick patterns reflect trader psychology. Combined strategies provide reliable entry points, enabling confident and precise trading decisions.
Regularly testing strategies and observing the alignment of multiple factors helps develop market intuition. By mastering entry signals, you can choose optimal moments for your trades and increase the effectiveness of short-term trading
```